VM 모니터링
VM 모니터링
Metric 기반 VM의 정확한 상태 확인을 위하여 Metric 저장/시각화에 특화된 모니터링 인스턴스 템플릿과 Metric정보를 수집하고 전송하는 기능을 제공합니다. 템플릿은 설정 변경을 통해 커스터마이징하여 사용할 수 있습니다.
모니터링 인스턴스 템플릿 특징
- 기본 저장소 설정 자동화
- 기본 대시보드 설정 자동화
10초 주기로 수집된 Metric 데이터는 2일 동안 보관되고 1분 주기로 Aggregation된 데이터는 7일 보관됩니다.
Metric 저장/시각화 인스턴스 기동 절차
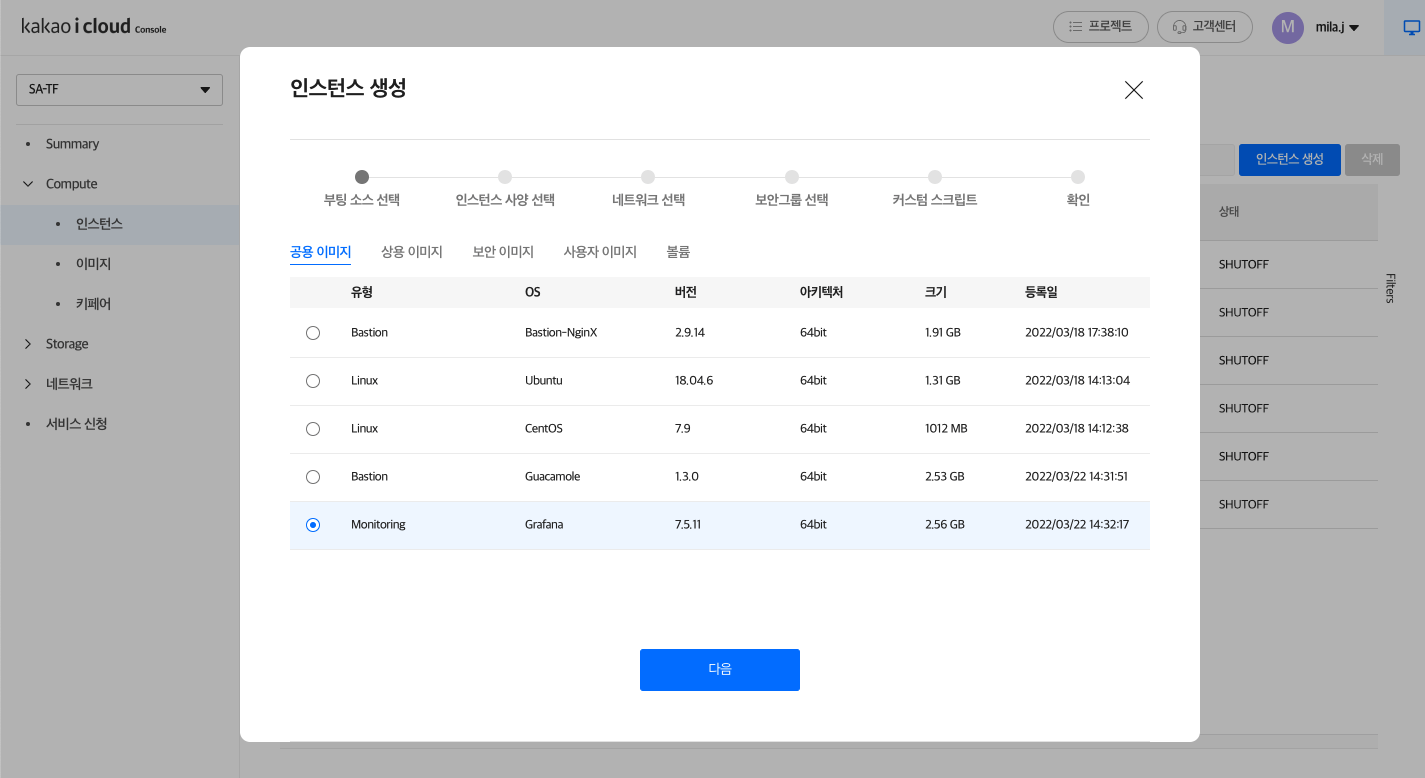
-
monitoring 이미지를 사용하여 VM 인스턴스(Metric Repo Instance)를 생성합니다.
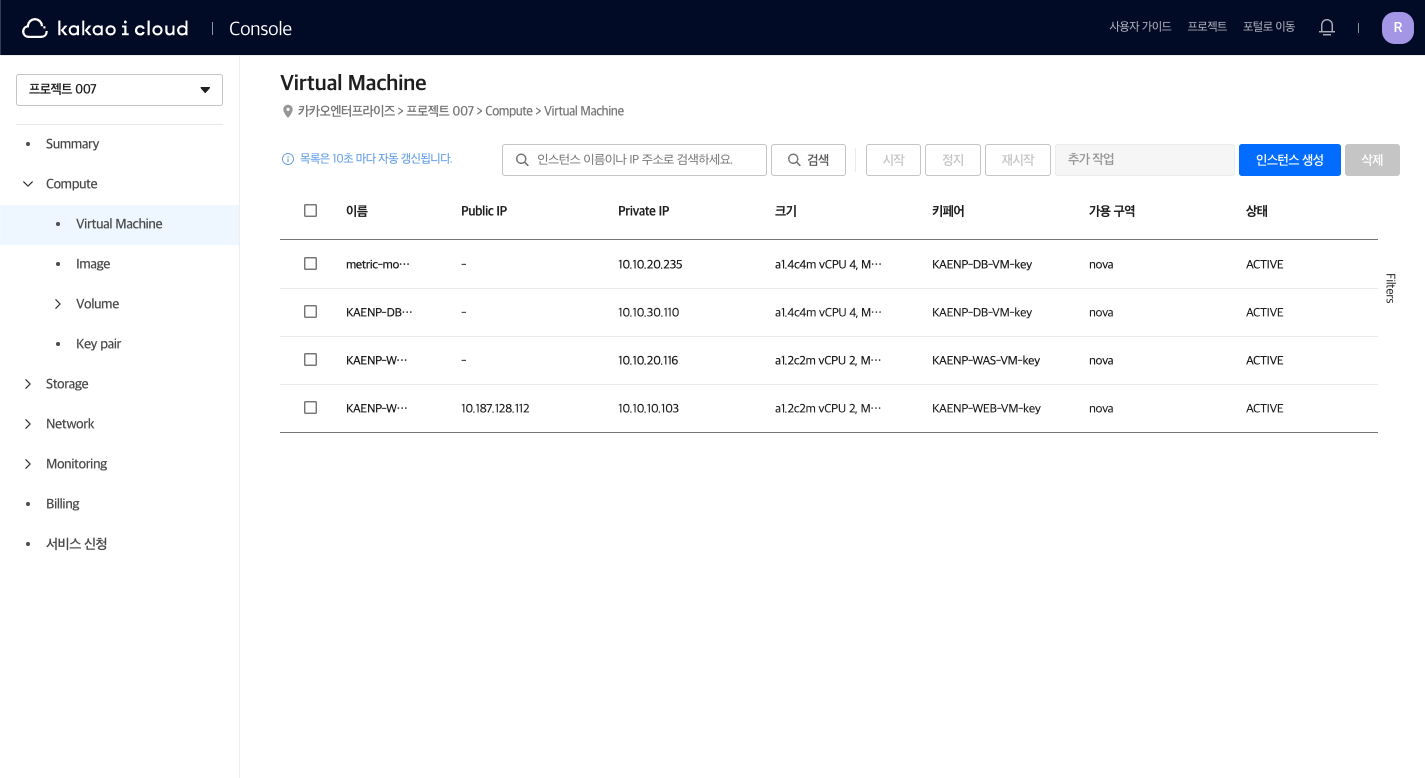
-
생성된 인스턴스의 IP(Metric Repo IP)를 확인합니다.
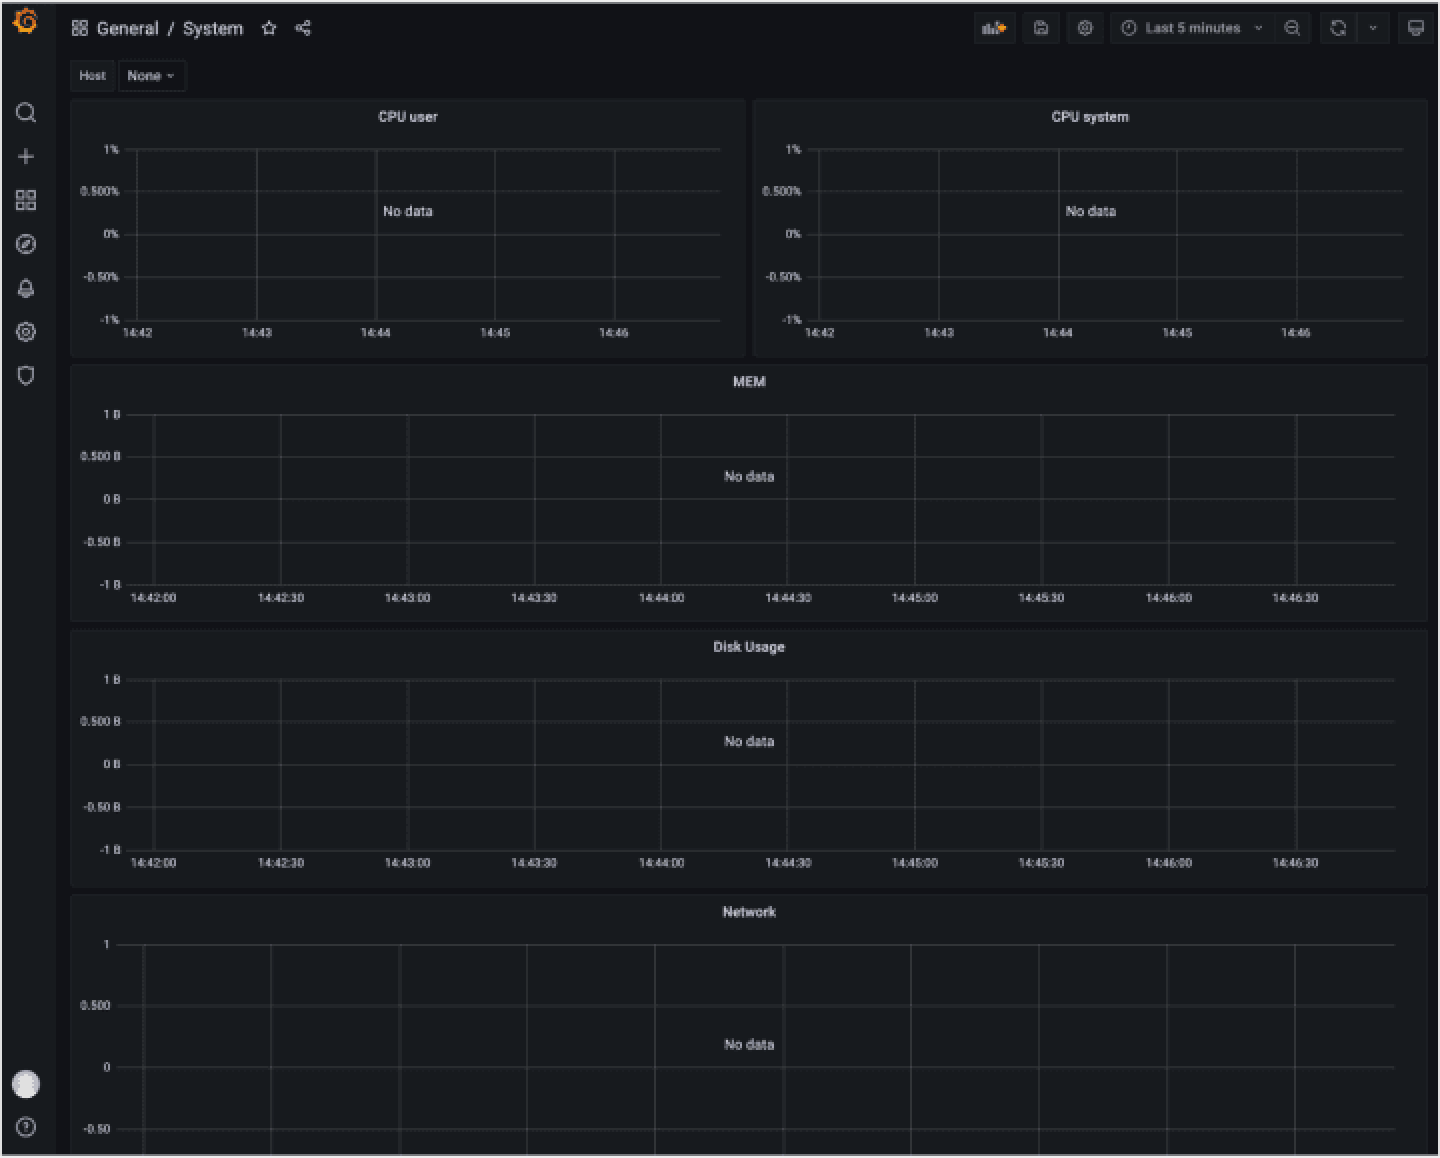
-
브라우저를 통해 생성된 저장소 도구에 접속하고 대시보드를 확인합니다.
-
대시보드 이용을 위해서 아래 정보를 확인해 주세요.
- Floating IP를 사용한 접근 설정을 위한 초기 계정은 admin / admin 입니다.
- 보안그룹 설정을 통해 접근가능한 IP 대역에 대한 제한을 권장합니다.
Metric Agent 기동 절차
기본 제공하는 대시보드는 Python Diamond Agent 규격을 지원하도록 구성되어있습니다.
-
Metric Agent(Python PIP 도구) 를 설치합니다.
wget https://bootstrap.pypa.io/pip/2.7/get-pip.py
sudo python get-pip.py -
Python PIP를 활용하여 Diamond를 설치하고 필요한 환경을 구성합니다.
sudo pip install diamond
sudo mkdir -p /var/log/diamond/ -
하기 내용으로 diamond.conf 라는 이름의 파일을 생성하여 Metric Agent 환경을 설정합니다.
diamond.conf 상세 내용
#################################################################################
Diamond Configuration File
################################################################################
################################################################################
### Options for the server
[server]
# Handlers for published metrics.
handlers = diamond.handler.graphite.GraphiteHandler, diamond.handler.archive.ArchiveHandler
# User diamond will run as
# Leave empty to use the current user
user =
# Group diamond will run as
# Leave empty to use the current group
group =
# Pid file
pid_file = /var/run/diamond.pid
# Directory to load collector modules from
collectors_path = /usr/share/diamond/collectors/
# Directory to load collector configs from
collectors_config_path = /etc/diamond/collectors/
# Number of seconds between each collector load
# collectors_load_delay = 1.0
# Directory to load handler configs from
handlers_config_path = /etc/diamond/handlers/
# Directory to load handler modules from
handlers_path = /usr/share/diamond/handlers/
# Maximum number of metrics waiting to be processed by handlers.
# When metric queue is full, new metrics are dropped.
metric_queue_size = 16384
################################################################################
### Options for handlers
[handlers]
# daemon logging handler(s)
keys = rotated_file
### Defaults options for all Handlers
[[default]]
[[ArchiveHandler]]
# File to write archive log files
log_file = /var/log/diamond/archive.log
# Number of days to keep archive log files
days = 7
[[GraphiteHandler]]
# Graphite server host
host = 0.0.0.0
# Port to send metrics to
port = 2003
# Socket timeout (seconds)
timeout = 15
# Batch size for pickled metrics
batch = 1
### Options for collectors
[collectors]
[[default]]
### Defaults options for all Collectors
# Uncomment and set to hardcode a hostname for the collector path
# Keep in mind, periods are seperators in graphite
# hostname = my_custom_hostname
# If you prefer to just use a different way of calculating the hostname
# Uncomment and set this to one of these values:
# smart             = Default. Tries fqdn_short. If that's localhost, uses hostname_short
# fqdn_short        = Default. Similar to hostname -s
# fqdn              = hostname output
# fqdn_rev          = hostname in reverse (com.example.www)
# uname_short       = Similar to uname -n, but only the first part
# uname_rev         = uname -r in reverse (com.example.www)
# hostname_short    = `hostname -s`
# hostname          = `hostname`
# hostname_rev      = `hostname` in reverse (com.example.www)
# shell             = Run the string set in hostname as a shell command and use its
#                     output(with spaces trimmed off from both ends) as the hostname.
# hostname_method = smart
# Path Prefix and Suffix
# you can use one or both to craft the path where you want to put metrics
# such as: %(path_prefix)s.$(hostname)s.$(path_suffix)s.$(metric)s
# path_prefix = servers
# path_suffix =
# Path Prefix for Virtual Machines
# If the host supports virtual machines, collectors may report per
# VM metrics. Following OpenStack nomenclature, the prefix for
# reporting per VM metrics is "instances", and metric foo for VM
# bar will be reported as: instances.bar.foo...
# instance_prefix = instances
# Default Poll Interval (seconds)
interval = 10
################################################################################
# Default enabled collectors
################################################################################
[[CPUCollector]]
enabled = True
[[DiskSpaceCollector]]
enabled = True
[[DiskUsageCollector]]
enabled = True
[[LoadAverageCollector]]
enabled = True
[[MemoryCollector]]
enabled = True
[[VMStatCollector]]
enabled = True
[[NetworkCollector]]
enabled = True
################################################################################
### Options for logging
# for more information on file format syntax:
# http://docs.python.org/library/logging.config.html#configuration-file-format
[loggers]
keys = root
# handlers are higher in this config file, in:
# [handlers]
# keys = ...
[formatters]
keys = default
[logger_root]
# to increase verbosity, set DEBUG
level = INFO
handlers = rotated_file
propagate = 1
[handler_rotated_file]
class = handlers.TimedRotatingFileHandler
level = DEBUG
formatter = default
# rotate at midnight, each day and keep 7 days
args = ('/var/log/diamond/diamond.log', 'midnight', 1, 7)
[formatter_default]
format = [%(asctime)s] [%(threadName)s] %(message)s
datefmt =
################################################################################
### Options for config merging
# [configs]
# path = "/etc/diamond/configs/"
# extension = ".conf"
#-------------------------------------------------------------------------------
# Example:
# /etc/diamond/configs/net.conf
# [collectors]
#
# [[NetworkCollector]]
# enabled = True
설정 내용중 Metric Server 주소 변경이 필요합니다.
sed -i ’s/0.0.0.0/10.0.100.164/‘ diamond.conf -
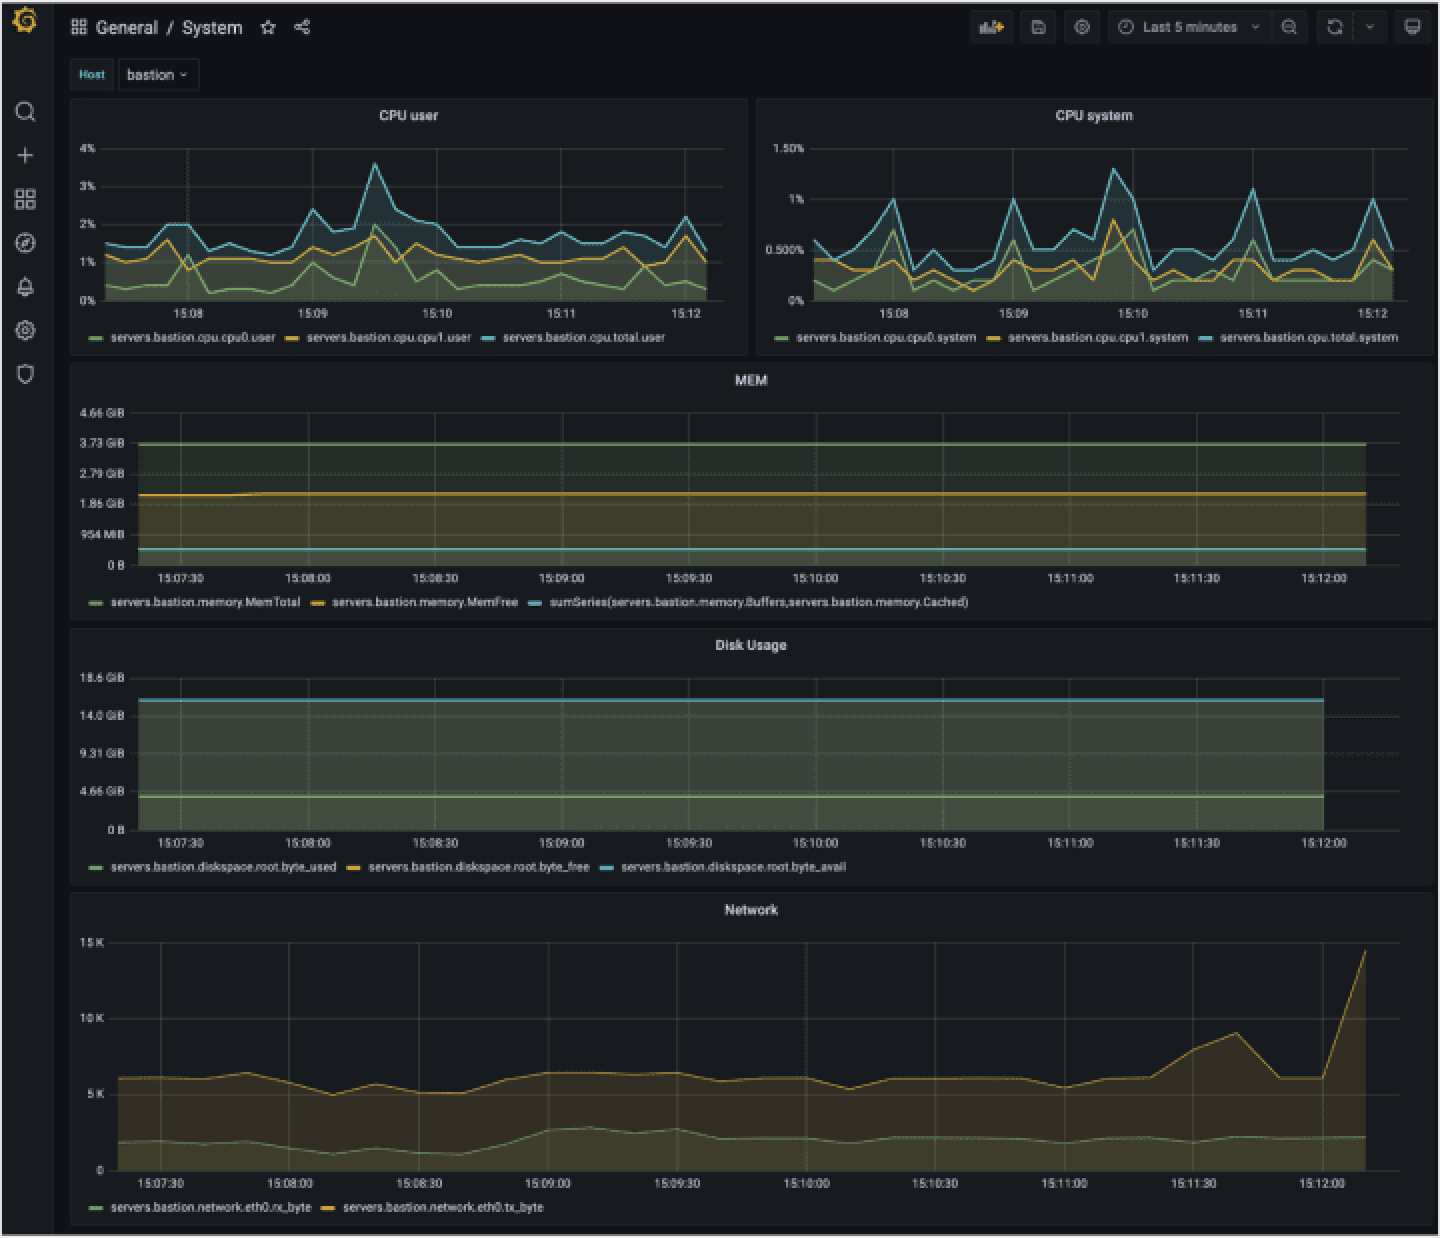
Metric Agent를 실행합니다.
sudo diamond -c diamond.config -
대시보드를 확인합니다. 대시보드를 통해 수집 정보가 표지되는지 확인합니다.
Email Alarm 설정을 위한 정보 등록
-
email을 통한 alarm 전송을 위해서는 Metric Repo Instance에 접속하여 다음의 파일을 수정합니다.
- /tools/monitor/grafana/custom.ini의 smtp 섹션 수정
[smtp]
enabled = true
host = smtp.test.com:587
user = test@test.com
password = test
from_address = test@test.com
from_name = Grafana -
/tools/monitor 디렉터리로 이동하여 다음 커맨드 실행을 통해 시스템에 반영합니다.
bash docker-compose downbash docker-compose up -d